Where Does the Rest of the Carbon Go?
A Smaller Annual Release Can Still Make the Atmosphere Richer in Carbon Dioxide
Imagine reading a meter that measures how much water enters a reservoir each day. Today’s reading is slightly lower than yesterday’s. Has the water level fallen? You need one more number to answer. How much flowed out? Climate headlines face the same problem whenever a change in annual emissions is used to predict the amount of carbon dioxide already in the air.
The Global Carbon Budget released on 10 November projects 38.2 billion tonnes of fossil carbon dioxide emissions in 2026, a fall of around 0.4 per cent. It also projects an increase in emissions from land-use change. The combined estimate is 43.3 billion tonnes. A small fall in one enormous incoming flow can coexist with continued growth in the amount overhead.
What Do Emissions and Concentration Actually Measure?
A tonne of CO₂ is a quantity of gas. A billion tonnes emitted in a year is a flow over time. Atmospheric concentration, usually reported in parts per million, measures the proportion of molecules in dry air that are CO₂. A reading of 425 parts per million, for example, would mean roughly 425 carbon dioxide molecules for every million molecules of dry air.
The numbers therefore come from different kinds of work. Researchers estimate fossil emissions from activity such as fuel use and cement production. Instruments measure atmospheric concentration by sampling air. A revised estimate of how much coal a country burned changes an emissions inventory. It does not retrospectively change the air that passed through a measuring instrument.
A further trap is the word carbon. A tonne of carbon and a tonne of carbon dioxide are different masses. CO₂ contains one carbon atom and two oxygen atoms. Compare figures in the same units before treating a difference between two charts as a scientific disagreement.
Where Does the Rest of the Carbon Go?
The ocean takes up some atmospheric CO₂ through exchange at the surface. On land, plants take in carbon through photosynthesis, and some remains stored in vegetation and soils. Respiration, decomposition and fire move carbon back into the air. The net effect of these immense exchanges determines how much of a year’s human emissions stays in the atmosphere.
“Absorbed by the ocean” can sound as if the carbon has simply disappeared. It changes seawater chemistry, contributing to ocean acidification. Carbon taken up by a forest also has a history ahead of it. It can remain in living wood for decades or return much sooner through fire. Counting storage requires specifying where the carbon went and over what period.
Natural uptake varies from year to year. Drought can weaken plant growth. Fires can release vegetation carbon. Changes in ocean conditions can alter exchanges with the air. That is why the annual rise in atmospheric CO₂ cannot be calculated by applying this year’s percentage change in fossil emissions directly to last year’s atmospheric reading.
How Can a Falling Monthly Reading Fit a Rising Trend?
Look at a long record of atmospheric measurements and you will see teeth along the rising line. Northern Hemisphere vegetation takes up carbon during the growing season. Later in the year the balance changes. The resulting seasonal rhythm is large enough for concentrations at a station to fall for several months even while successive years set higher levels.
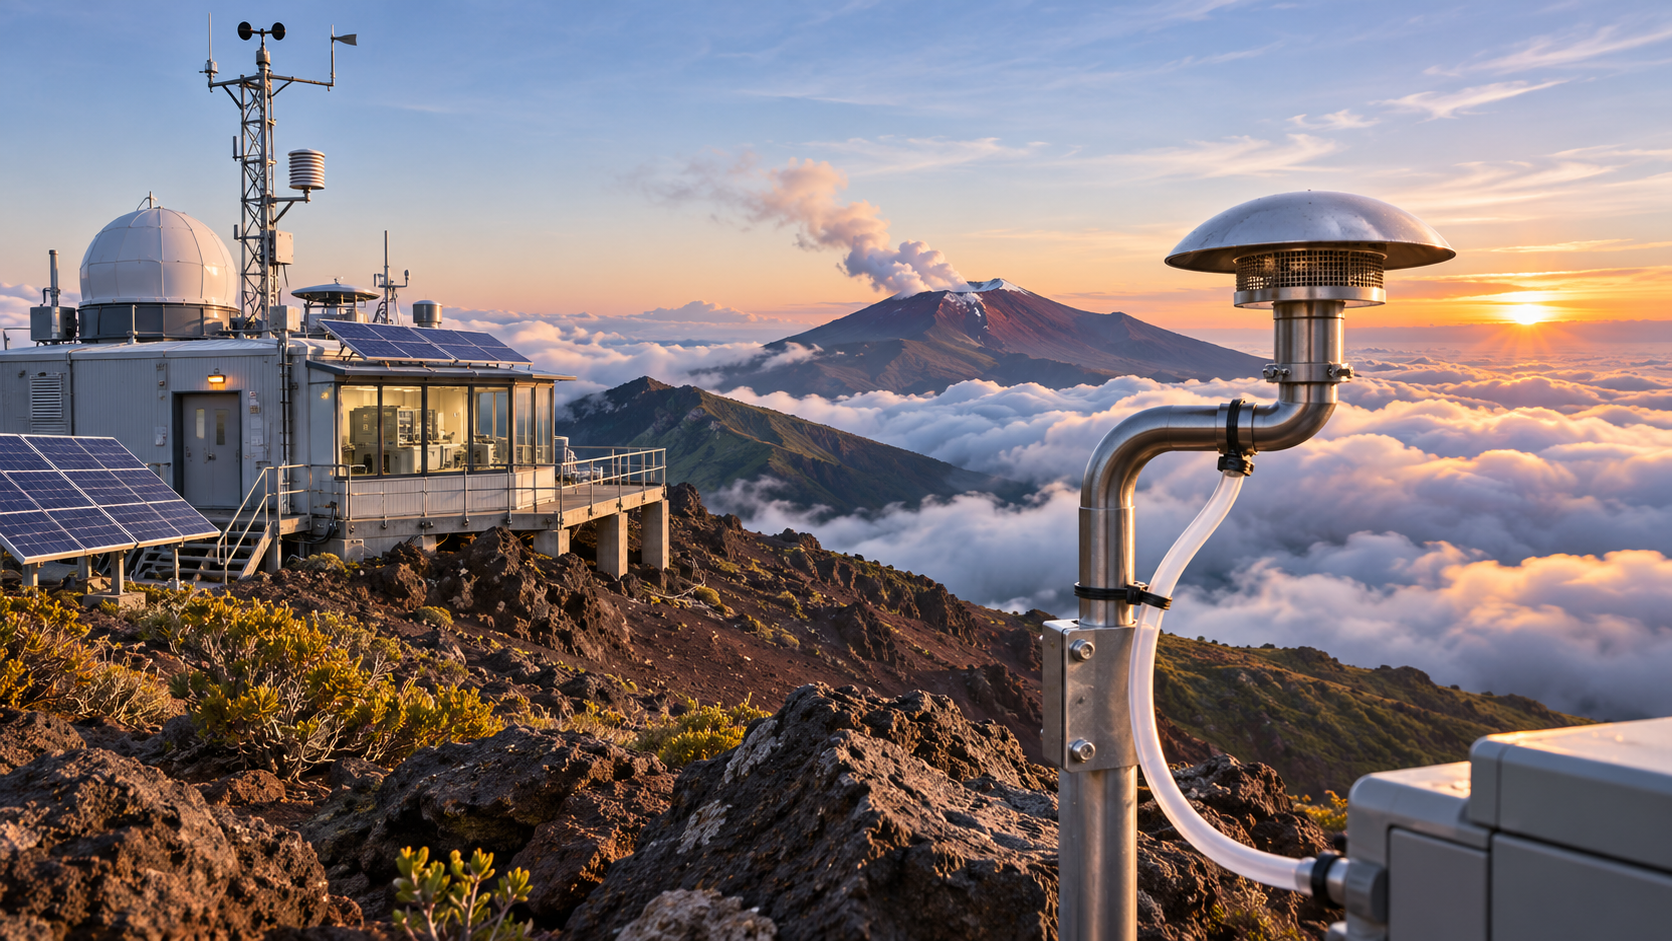
Compare like with like. A May reading against the preceding September folds the seasonal cycle into the comparison. May against earlier Mays answers a different question. A global annual average and a single daily reading from Mauna Loa also describe different samples. A headline about a record should identify which series set it.
Would Deeper Cuts Make a Difference Before Net Zero?
Yes. Every tonne of CO₂ kept out of the atmosphere reduces cumulative emissions relative to what they would otherwise have been. A concentration can rise more slowly than it would have under higher emissions. Both curves on a chart might still slope upwards, but the gap between them represents a real change in the amount of carbon added.
Sustained net zero CO₂ means human releases are balanced by human-caused removals. In climate projections, reaching it is central to halting further CO₂-driven warming. Atmospheric concentrations and surface temperatures respond on different timescales, and methane and other climate drivers have their own behaviour. There is no single morning on which all the planet’s indicators turn together.
Why Can Global Totals Move Differently From Individual Countries?
Think of a year in which electricity from coal falls in one large economy while demand for oil rises elsewhere. Both developments will appear in national accounts. The global total reflects the sum of the changes, weighted by the tonnes involved. Ten countries recording small percentage reductions might be outweighed by one large emitter increasing its output. Counting countries is a poor substitute for counting emissions.
Trade complicates the national picture. An emissions inventory organised around where fuel is burned will assign factory emissions to the producing country. A consumption-based analysis asks which households and businesses ultimately buy the output. A country can lower territorial emissions by changing how it generates power, by importing goods it once made at home, or through a mixture of both. Moving production across a border changes the geographical account more readily than it changes the global atmosphere.
Would a Recession Produce the Same Climate Benefit as Cleaner Electricity?
In the year of the reduction, the atmosphere responds to the quantity of CO₂ released. The reason for the reduction matters enormously to what happens next. A factory temporarily closing lowers fuel demand until it reopens. A grid replacing fossil generation with low-carbon power can change the emissions attached to every future hour of operation. Two identical dips in an annual graph can be the beginning of very different trajectories.
The question to ask of a forecast is therefore what must persist for the reduction to repeat. Is power generation changing? Are vehicles and heating systems becoming more efficient? Have fuel prices temporarily suppressed use? The answers help readers interpret the durability of a fall. They cannot be inferred from the change in global concentration during one unusually wet or dry year.
What Would Make the 2026 Fall Significant?
The November figure is a projection made before the year has ended. Its small size matters when interpreting uncertainty and future revisions. A run of sustained reductions across fuels, sectors and countries would tell us much more about a durable shift than a single downward movement. The land-use estimate belongs alongside the fossil figure whenever the claim concerns total human CO₂.
Read the next headline by asking which quantity has fallen. Fewer tonnes emitted this year, a smaller annual increase in atmospheric concentration and a sustained decline in the concentration itself are three progressively different developments. The world can achieve the first while still working towards the second and third.
Sources
Global Carbon Budget | Fossil CO2 emissions decrease in 2026
Fossil CO2 emissions decrease in 2026, according to the Global Carbon Budget | ICOS
